Costco members shop Costco 25 times per year. Thrive Market members shop Thrive 3.7 times. Can Thrive close the gap? Is Trips Per Year the right KPI for Thrive to focus on?
In this newsletter, you’ll learn about the metrics that drive Annual Spend Per Member, Shopper Segmentation, and why it’s still valuable to compare one retailer to another that is 500x the size.
Thrive Market was founded in 2014 with the mission to make healthy and sustainable living easy, affordable, and accessible for everyone. Thrive sells high-quality grocery items to its paid members including non-perishable food, frozen meat and seafood, wine, and home and body products. They do not sell fresh produce.
Think of Thrive as Costco + Whole Foods + ecommerce.
A key part of this newsletter is a comparison of Thrive Market to Costco. The podcast Acquired has a breakdown of Costco's business and I use their episode as a point of reference.
I am introducing two new segments to these newsletters. First, as seen below, can be thought of as an Executive Summary if this was an internal business document. Second, Takeaways.
This newsletter has three sections:
Per Member Spend
Trips Per Year
Member Segmentation
Per Member Spend
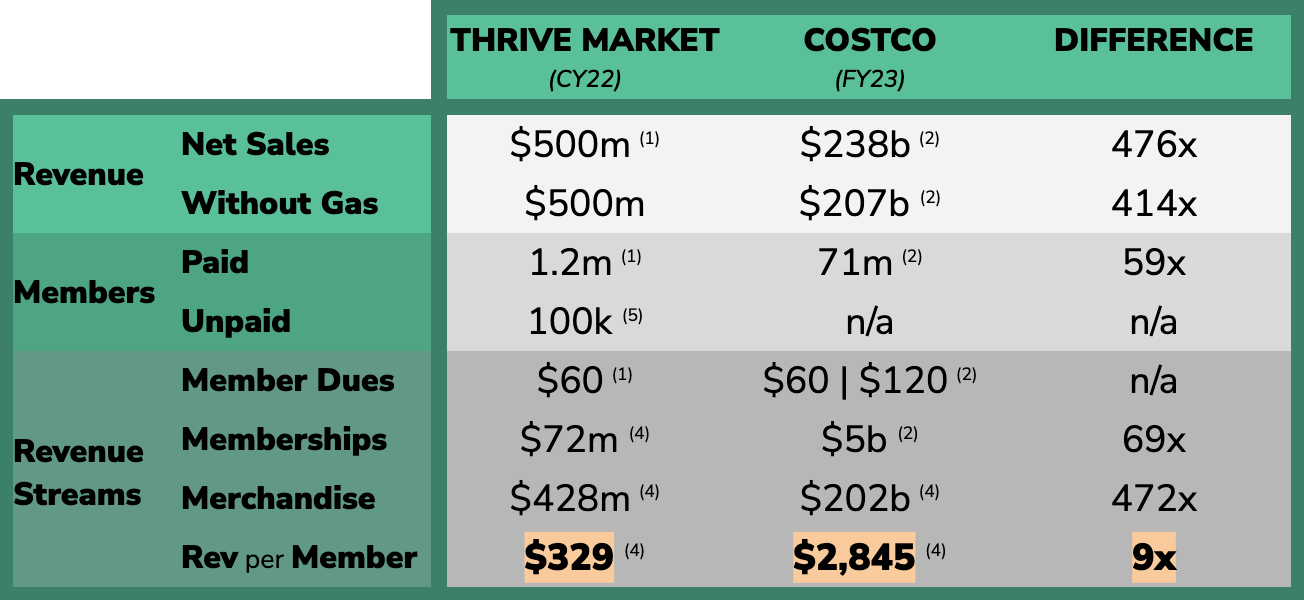
Thrive and Costco have two overlapping revenue streams: membership dues and merchandise sales. Costco has a third revenue stream in the form of selling gas, which we'll exclude for obvious comparison reasons.
In 2022, Thrive brought in half a billion dollars of revenue off 1.2 million paid members.1 At $60 per membership, revenue from membership dues was $72 million, leaving the balance of $438 million as merchandise revenue. This $72 million represented 14% of Thrive's revenue, which over-indexed that of Costco, where Costco's $4.6 billion in membership dues equaled 2% of their net-gas sales of $207B.2
This variance of 14% versus 2% means that the average Costco member spends significantly more at Costco than the average Thrive member spends at Thrive.
We shouldn't be surprised by this. Costco is a globally-recognized brand, a true incumbent in grocery and retail, and they sell many more categories than Thrive does. This ranges from fresh produce and clothing to high-priced electronics and appliances. Nonetheless, there is value in better understanding differences in household spend between the retailers.
Through their Thrive Gives program, each paid membership sponsors a free membership to a family for a year. Let’s say Thrive has an additional hundred thousand unpaid memberships for a total of 1.3 million members.
From this, we are able to calculate the sales dollars spent at Thrive every year per member as $329 ($428m / 1.3m).
Compare this to Costco, where the average member spends $2,845 ($202b / 71m), or nearly 9x more than at Thrive.
(1) Yahoo finance; (2) Costco Annual Report, FY23, (3) Motley Fool, (4) calculated, (5) estimate
The above section is heavy on analysis. In the next section, I start making interpretations and observations of the data aggregated.
Trips Per Year
Revenue Per Member is calculated from Trips Per Year multiplied by Sales Dollars Per Trip. Thrive had a recent profile in Yahoo Finance in which some values were provided, allowing me to calculate the remaining values.
The article provided the following: the average Thrive member purchases fifteen items per trip, spending $90. The average Price Per Unit is then calculated as $6 and Trips Per Year as 3.7 ($329 / $90).
A 2022 Motley Fool article shared that the average spend per trip at Costco is $114 across 9 units. This results in an average Price Per Unit of $13 and Trips Per Year per member as 25 ($2,845 / $114).3
I know, I know. Average spend per trip (aka AOV) of $114 at Costco seems woefully low. The author of the Motley Fool article did not state his sources nor was I able to corroborate these data points across Google, Gemini, nor ChatGPT. Consider it directional guidance.
(1) Yahoo finance; (2) Costco Annual Report, FY23, (3) Motley Fool, (4) calculated, (5) estimate
We shouldn't be surprised that the average price per unit is more than double at Costco than at Thrive. This is in line with expectations based on the aforementioned point of Costco selling higher priced items like electronics and appliances.
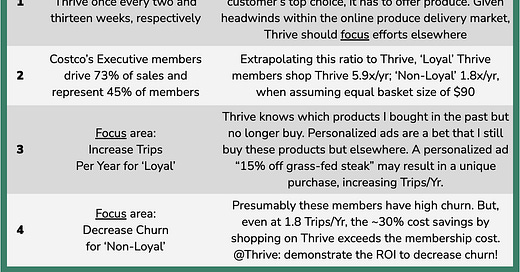
The second observation gets to what is most salient: Trips Per Year. The average Costco member shops Costco once every two weeks (52 weeks / 25 trips). The average Thrive member shops Thrive once every three months (52 weeks / 3.7 trips).
I interpret this as to Costco members, Costco is either a member's primary or secondary retailer they shop at. Less so with Thrive members with Thrive most likely being the third, fourth, or fifth most frequent retailer they shop at.
Imagine if Thrive targeted increasing Trips Per Year and they got each member to shop Thrive once more per year. On paper this sounds doable. This would result in a 23% increase in revenue (1 Trip * $90 AOV * 1.3m members = $117M / total revenues of $500m).
Member Segmentation
Costco offers two memberships - Gold at $60 and Executive at $120. 45% of their members are Executive but Executive members represent 73% of Costco's revenue.
Let’s extrapolate Costco’s member segmentation to Thrive’s. We’ll say Thrive’s loyal members are their top 45% members and they drive 73% of Thrive’s $428M in merchandise revenue, or $312m.
If ‘Loyal’ and ‘Non-Loyal’ Thrive members each have an AOV of $90, then the former shops Thrive on 5.9 occasions per year while the latter 1.8 times per year.
(1) Yahoo finance; (2) Costco Annual Report, FY23, (3) Motley Fool, (4) calculated, (5) estimate
This segmentation allows me to draw conclusions to the two most important levers for Thrive’s Leadership team to focus on to drive revenue growth within existing members:
Increase Trips Per Year for ‘Loyal’ members
Decrease Churn for ‘Non-Loyal’ members
Increase Trips Per Year for ‘Loyal’ Members
Category expansion is the easy option to increase Trips Per Year for Loyal members – Thrive should offer fresh produce. But not so fast, as offering perishable goods is very challenging operationally and there are market headwinds – Imperfect Foods and Misfits Market have both stalled in fanfare in years past.
So if not category expansion, meaning Thrive members will have to continue to shop elsewhere for fresh produce such that Thrive will never be a member’s number one or two retailer, unlike at Costco, how do they increase Trips Per Year?
Here’s a suggestion: offer personalized ads. Thrive just like Costco, from Day 1, has per shopper granularity. If a data scientist or analyst looked at my shopping history, they would see that I used to buy a lot of Kettle and Fire bone broth, LMNT, and Four Sigmatic protein powder. But if I haven’t in months past, that probably means I now buy directly from those brands’ websites or I switched to a new product.
A personalized ad would be a bet – a bet that I’m still in the market for those goods but buy them elsewhere. This bet is an investment – Thrive may even need to subsidize the discount such that it doesn’t come out of the brand’s Trade Marketing budget.
Let’s say the personalized ad is 15% savings on LMNT. I as a shopper am now more likely to buy LMNT from Thrive again (vs. LMNT’s own website) and will add additional goods to my cart to meet the $49 for free shipping.
Personalized ads can increase Trips Per Year for ‘Loyal’ members.
Decrease Churn for ‘Non-Loyal’ Members
I don’t have data to report on Thrive’ churn rates, but if 55% of their members shop Thrive 1.8 times per year – again, this is my extrapolation, not known data – then it’s safe to say a high percentage of these members churn.
Here’s a suggestion to retain ‘Non-Loyal’ members: do the math for them. Per the above table, these members spend $162 at Thrive every year. Given that Thrive states 30% savings, this means that a member would have otherwise spent $231 ($162 / (1 - 30%)) to buy the same or equivalent goods.
That delta of $69 ($231 - $162) means that despite these members hardly shopping at Thrive, they came out on top! The $69 in savings exceeds the $60 membership fee. So the membership is already worth it for them, and those savings will only increase as Thrive educates these members on their personal “ROI.”
Please let me know what you thought of this newsletter in the comments below!
Thrive had reported revenues of nearly $500M in 2022 and revenues greater than $500M in 2023. Considering the Yahoo Finance article I referenced was based on 2022 numbers, I use 2022 Revenues of $500M.
Costco’s revenue from membership dues stumped me for the longest time. I could not reconcile their reported membership revenue of $4.6 billion with their membership breakdown of 32.3 million Executive memberships and 38.7 million Gold and Business memberships. I calculated their membership revenues as (32.3m * $120) + (38.7m * 60) = $6.2b. Chat GPT came in handy here, explaining the discrepancy of $1.6b ($6.2b - $4.6b) based on the following:
An upgrade to an Executive membership partway through the year is prorated
Timing and accounting methods
Different membership prices internationally
Potential discount if someone plans to cancel and Costco offers renewal discount
Costco does not break out shopper segmentation such as Trips Per Year and AOV so I rely on the Motley Fool article. The author does not state his sources for Units Per Trip nor AOV. The article was written in July 2022 so presumably the author uses metrics from Costco’s FY2021 whereas I use FY2023. This means I’m assuming Units Per Trip and AOV does not change between these years. Ultimately, I use the Motley Fool article for directional guidance as I was not able to corroborate these assumptions across Google, Gemini, nor ChatGPT.


Also I recently studied Instacart’s S1 and they claim only 12% of grocery transactions currently happen online. A lot of room for change here.
Really interesting Jack. I was not aware of Thrive Markets scale. After studying them, what do you think is their unique value proposition in comparison to Amazon?